The database on ambient (outdoor) air pollution – the largest of its kind – covers 1600 cities and 91 countries, and indicates where air pollution levels and the related health risks are higher. The aim of this database is not to rank cities or countries but to reflect the monitoring efforts undertaken in those countries.
World Health Organization (WHO) has brought together this information on ambient air pollution collected by cities worldwide in order to raise awareness and facilitate adequate responses to protect public health from the adverse impacts of outdoor air pollution.
Many cities in the world, including some expected to be among the most polluted, do not collect information or report on its ambient air quality. WHO therefore cannot compare cities based on their levels of outdoor air pollution.
Cities that collect and disseminate information on outdoor air quality need to be praised for their action.
This is the first crucial step to identify if there is an outdoor air pollution problem and to begin to take corrective action. The cities which have invested in the capacity to regularly monitor and report the local air quality measurements have already demonstrated a commitment to starting to address air quality issues and public health.
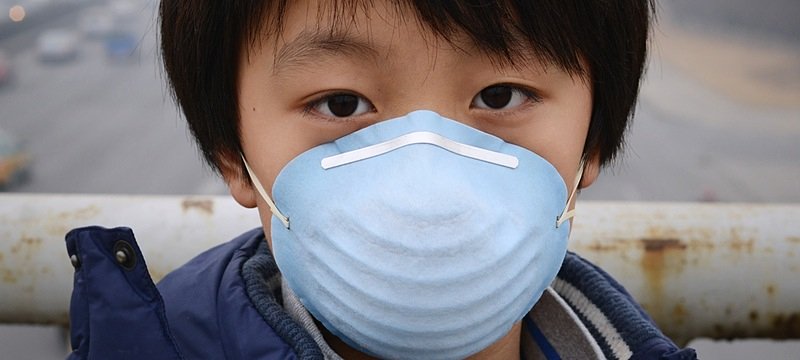
Air pollution consists of many pollutants, among other particulate matter. These particles are able to penetrate deeply into the respiratory tract and therefore constitute a risk for health by increasing mortality from respiratory infections and diseases, lung cancer, and selected cardiovascular diseases.
The number of deaths caused by air pollution are estimated on the basis of the air quality levels people are exposed to, and the increased risks of cardiovascular and respiratory diseases that are incurred at
those levels. The air quality levels are estimated on a combination of satellite information, chemical transport models and ground measurements of air quality, and the increased risks come from epidemiological studies.
In April 2014, WHO issued new information estimating that outdoor air pollution was responsible for the deaths of some 3.7 million people under the age of 60 in 2012. The Organization also emphasised that indoor and outdoor air pollution combined are among the largest risks to health worldwide.
WHO recommends that levels of fine particles called PM2.5 should not be more than 10 µg/m³ on average over a year, and slightly larger pollutants, called PM10, should not reach more than 20 µg/m³ on average.
Indicator used: Annual mean concentration of particulate matter of less than 10 microns of diameter (PM10) [µg/m³]
30. Darkhan (Mongolia)
174 µg/m³ – (2009)
29. Dehradun (India)
175 µg/m³ – (2011)
28. Hidd (Bahrain)
178 µg/m³ – (2012)
27. Dakar (Senegal)
179 µg/m³ – (2012)
26. Dhaka (Bangladesh)
180 µg/m³ – (2013)
25. Narayonganj (Bangladesh)
181 µg/m³ – (2013)
24. Rajshahi (Bangladesh)
195 µg/m³ – (2013)
23. Jodhpur (India)
196 µg/m³ – (2012)
22. Lahore – Johar Town (Pakistan)
198 µg/m³ – (2010)
21. Agra (India)
200 µg/m³ – (2010)
20. Khanna (India)
200 µg/m³ – (2012)
19. Allahabad (India)
202 µg/m³ – (2010)
17. Ludhiana (India)
207 µg/m³ – (2012)
17. Amritsar (India)
210 µg/m³ – (2012)
16. Kanpur (India)
212 µg/m³ – (2010)
15. Firozabad (India)
219 µg/m³ – (2010)
14. Lucknow (India)
219 µg/m³ – (2010)
13. Nabih Saleh (Bahrain)
244 µg/m³ – (2012)
12. Ras Hayan (Bahrain)
250 µg/m³ – (2012)
11. Ma’ameer (Bahrain)
257 µg/m³ – (2012)
10. Kabul – ISAF HQ (Afghanistan)
260 µg/m³ – (2009)
9. Karachi (Pakistan)
273 µg/m³ – (2010)
8. Delhi (India)
286 µg/m³ – (2010)
7. Raipur (India)
305 µg/m³ – (2012)
6. Hamad Town (Bahrain)
318 µg/m³ – (2012)
5. Ahvaz (Iran)
320 µg/m³ – (2010)
4. Gwalior (India)
329 µg/m³ – (2012)
3. Mazar-e Sharif – Camp Northern Lights (Afghanistan)
334 µg/m³ – (2009)
2. Rawalpindi (Pakistan)
448 µg/m³ – (2010)
1. Peshwar (Pakistan)
540 µg/m³ – (2010)
Source World Health Organization